
Analytics Update
In preperation of the upcoming 6.5 release with architecture updates to the Analytics features, Akumina has recently made enhancements to the Analytics Engine and Dashboard. This will affect the following versions 6.2, 6.1, and 6.0. For clients using the Analytics Dashboard in version 5.5, please contact Akumina Technical Support for steps to preserve data.
For all clients using the Analytics Dashboard, this functionality is being removed from the AppManager and will be accessible in the front-end "Voice" interface.
Full release notes are available:
- v6.2 - https://www.akumina.com/community/release-6-2
- v6.1 - https://www.akumina.com/community/release-6-1
- v6.0 - https://www.akumina.com/community/release-6-0
To have the changes reflected in your deployment, please open an Upgrade Ticket with Akumina Support.
For a demo of the changes, contact Akumina Customer Success.
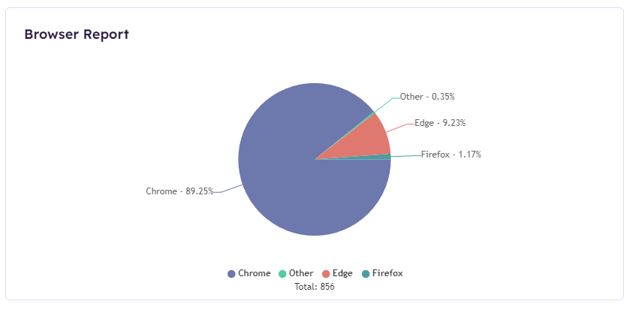
Browser Report Widget
Pie chart will show percentages of which browsers viewed across all platforms.
Content Editors Trend Widget
Table that shows edited content with information about the editor
Content Report Widget
Table that shows content that has been updated or created by the current users
Documents Trend Widget
Table that list most viewed documents
Geographic Report Widget
Bar chart that will show total and unique views by Country/Region

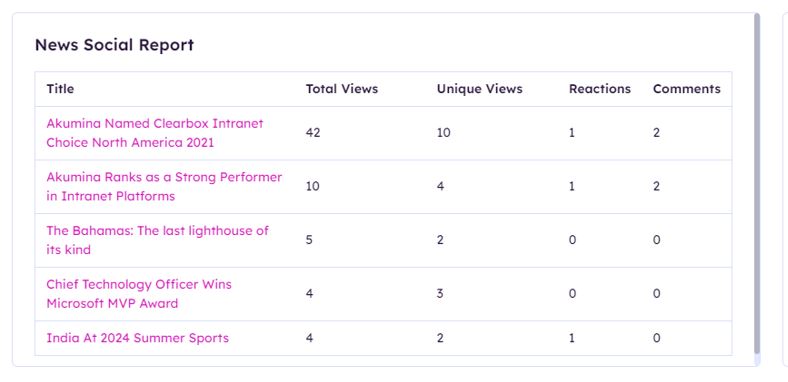
News Social Report Widget
Table that lists top viewed news articles and corresponding social data
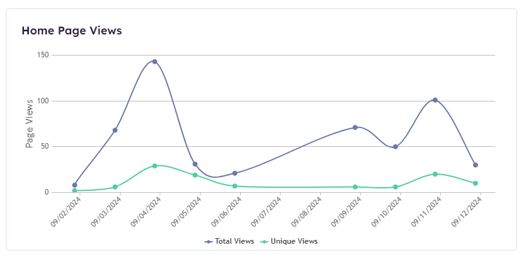
Page Views Report Widget
A line graph that shows total and unique views for the configured page (Home Page)
Platform Report Widget
A pie chart that shows percentages of which platforms (i.e. desktop, mobile, mobile app, etc.) have viewed the site

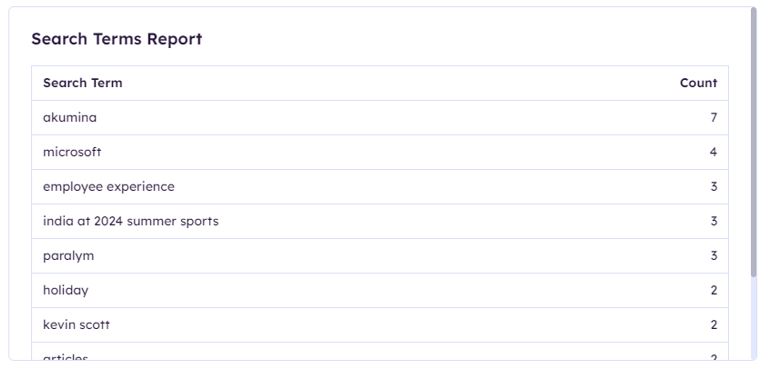
Search Terms Report Widget
Table that lists out the most searched terms
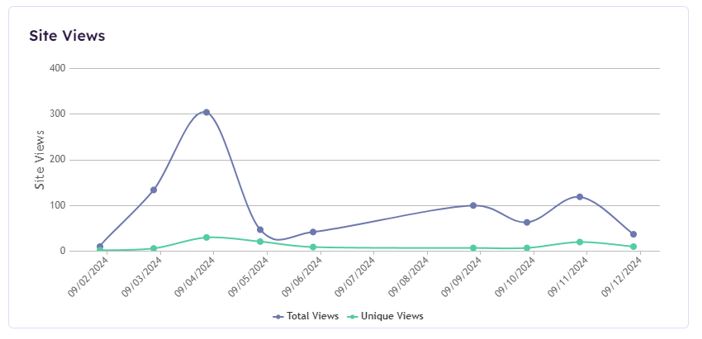
Site Views Report Widget
A line graph that displays count of total and unique views for these selected views.
Top Commented Items Report Widget
A table that lists the content that has received the most comments
Top Page Report Widget
A table that will show the titles and URLs of the top-viewed pages, ordered by views

Top Reacted Items Report Widget
A table that will display the content receiving the most social reactions
Top User Report Widget
A bar chart that will display the users with the most views
Top Viewed News Widget
A table that will list the top-viewed news articles with corresponding social data
Total Page Views Report Widget
Bar chart that will display total page views by day
User Trend Widget
A bar chart that will number of users by day for the selected site
Top Commentors Report Widget
A bar chart that will show the users with the highest number of comments
Top Reactors Report Widget
Bar chart that will display the users with the highest number of social reactions
Notes:
- Top Commented, Top Commentors, Top Reacted Items, and Top Reactors report widgets ARE NOT affected by site picker
- All widgets will respect the time period selected using the global time range picker at the top of the module, except for the Document Trend Report Widget
- Content Report is NOT affected by date for the list of items, BUT IS affected by date for item views in the report
- Count Report is NOT affected by date because it returns all items
